The rust one is called bottom (btm) see the other thread :). When you already have a rust environment it is just at a cargo install away which is convenient.
Open btop in the terminal, then (note the terminal window must not be in fullscreen) right click with the mouse on the top bar of the terminal window and select “Always on top”.
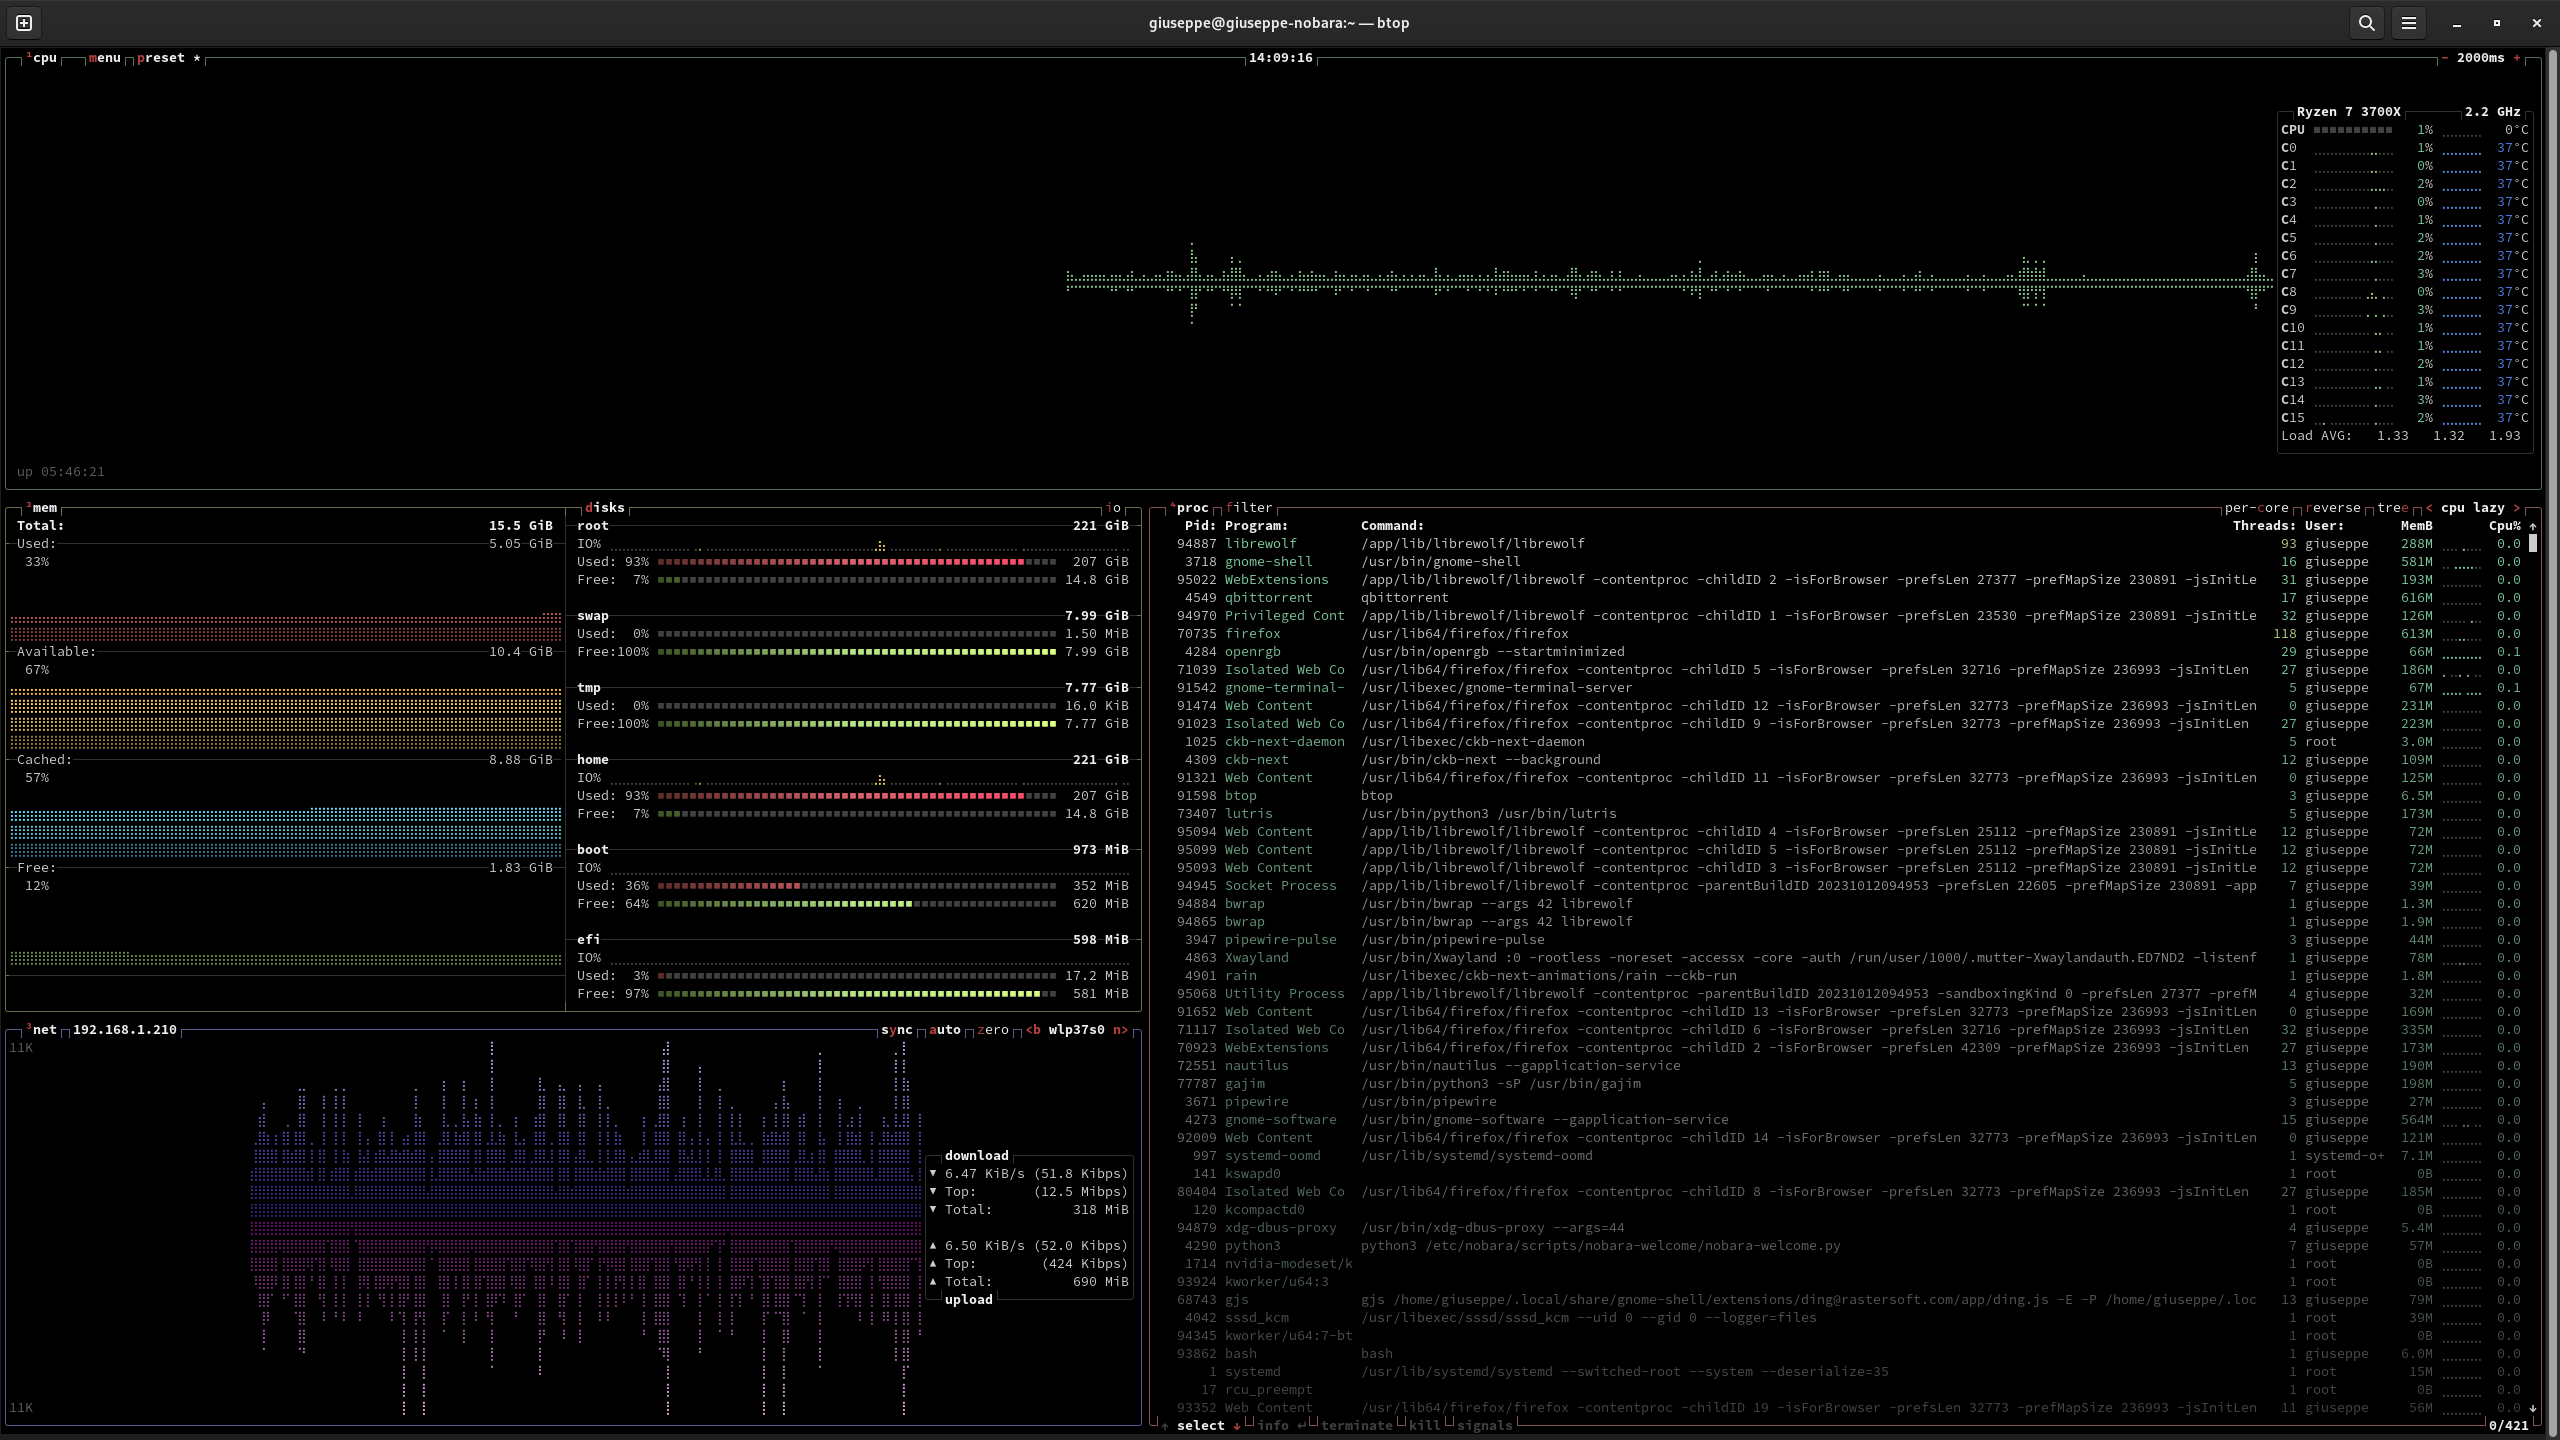
Just found this too, through the rust post some days ago…but its quite obvious that from a usability context that btop is easier to use. With bottom you have to memorize all hotkeys wheres btop is showing them right in the interface.
Yea. I was using bottom until I saw this and did a quick side-by-side comparison (nix-shell -p btop, I use NixOS BTW). btop’s UI is just so much better.
I made the swich a year or two ago. It is much better I find. I leave it running in a tmux session on my server . with btop on one pane and switch to another with a split view to do work. It allows me to take a quick glance at any time while not taking the focus from what I was working on.
I saw him with “-1” so actually 2 people not just one person have misclicked according to your theory. Hmmm i don’t know, but i hope it’s true, better then the alternative
I like Netdata because it’s web based, has a large number of metrics, you can pan/zoom the graphs, and it doesn’t use much CPU power. Console UIs are nice but they’re more limiting than something web-based.
You have a pre-installed tool and a tool that looks better but which you need to install. When you need it for a rare task, and you administer many machines, it is easier to use what you already have on each of them.
Sorry, I don’t understand what you are talking about. Yes, you can run them in SSH session. No, you still need to have them installed on the remote machine to do this. And installing diagnostic tools is not only time consuming, sometimes it can be even impossible if you already get in troubles (and if you did not, why would you need them?).
Cringe take. I’ts just a fun pretty system monitor tool. I work as a senior cloud architect. I have 10 years of pretty heavy professional and home Linux usage and I just installed it on my home server because I have a unused 1/3 on one of my monitors at home where it can just live forever inside tmux.
It’s fun to see Plex take more resources because someone started a stream, or see the different parts of kubernetes working when I start a few containers. I have also added a drive to my btrfs raid so I was interested in seeing what kinda load the re balance did on the system over time. Turns out not much. It’s a fun tool.
I use different tools on the several Azure environments I am part of maintaining lol.
It’s a tool. It’s useful to figure out if something you’re running is IO-bound or CPU-bound. It also shows per-core load, which is useful for visualizing multi-threaded performance.


Add comment