Some of y'all need to see this and drop the superiority complex...
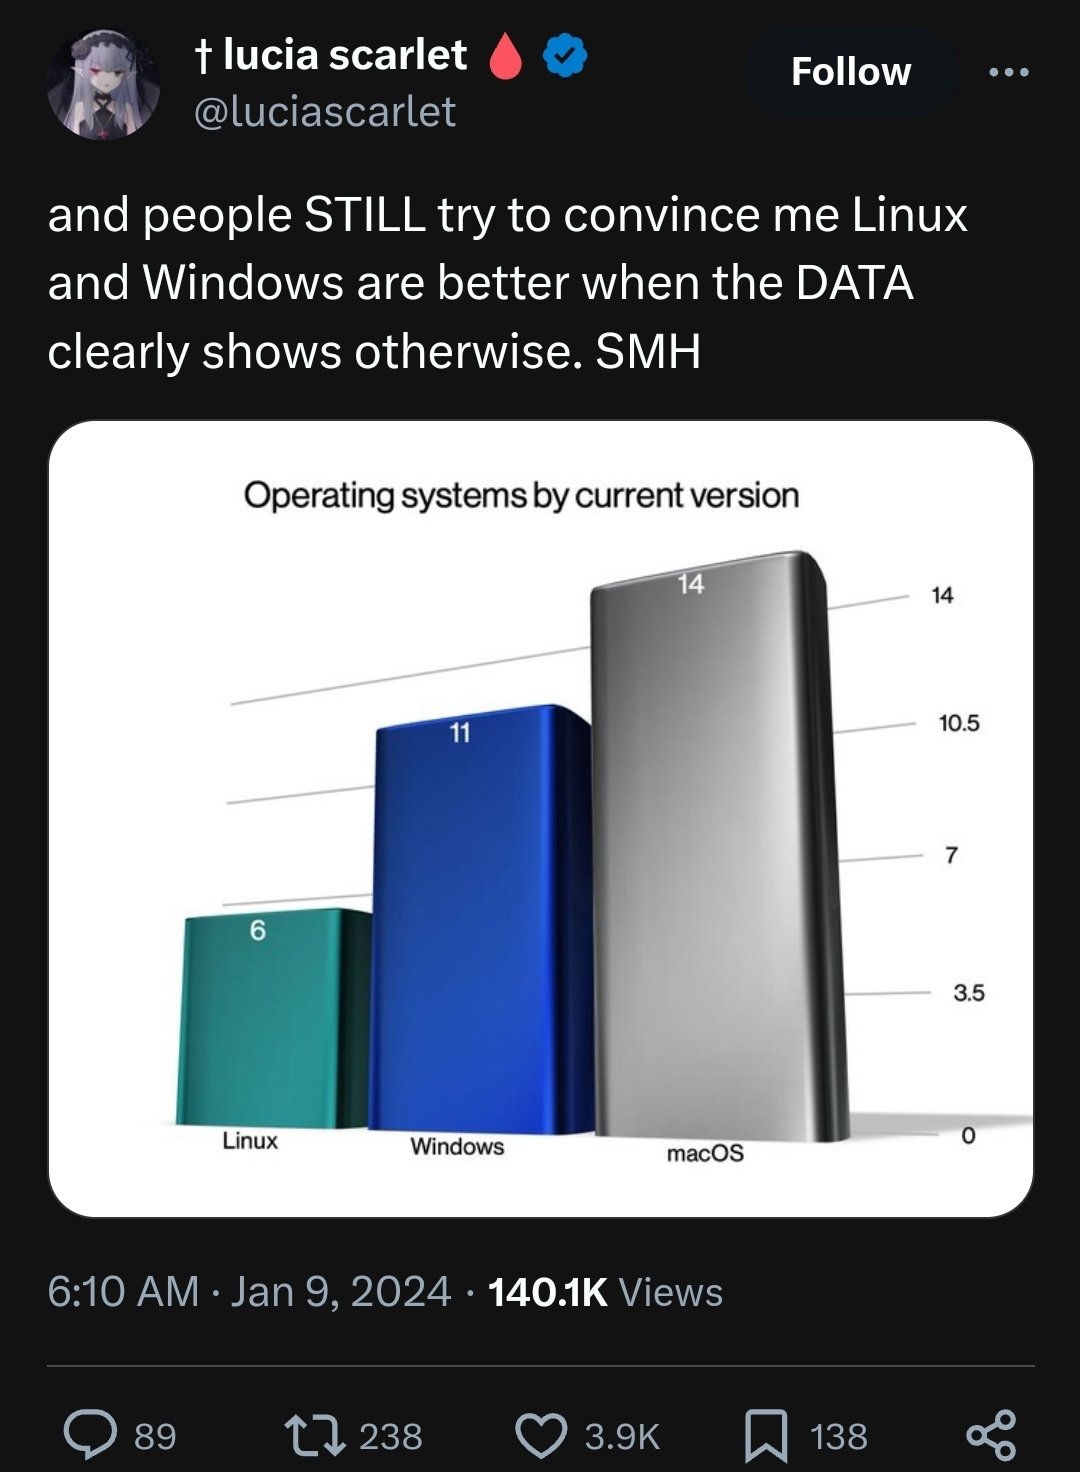
Image shows a tweet with the header “and people STILL try to convince me Linux and Windows are better when the DATA clearly shows otherwise. SMH” with an image attached showing the following:
“Operating systems by current version” Mac OS: 14 Windows: 11 Linux: 6


Add comment